
This tutorial shows how to:
- Load and work with SVG files using the Snap.svg JavaScript library.
- Parse SVG drawings exported from Visio 2013 to read data and interact with the shapes.
To help with this I have exported a simple SVG from Visio that I will load into a web page and parse to get its data:
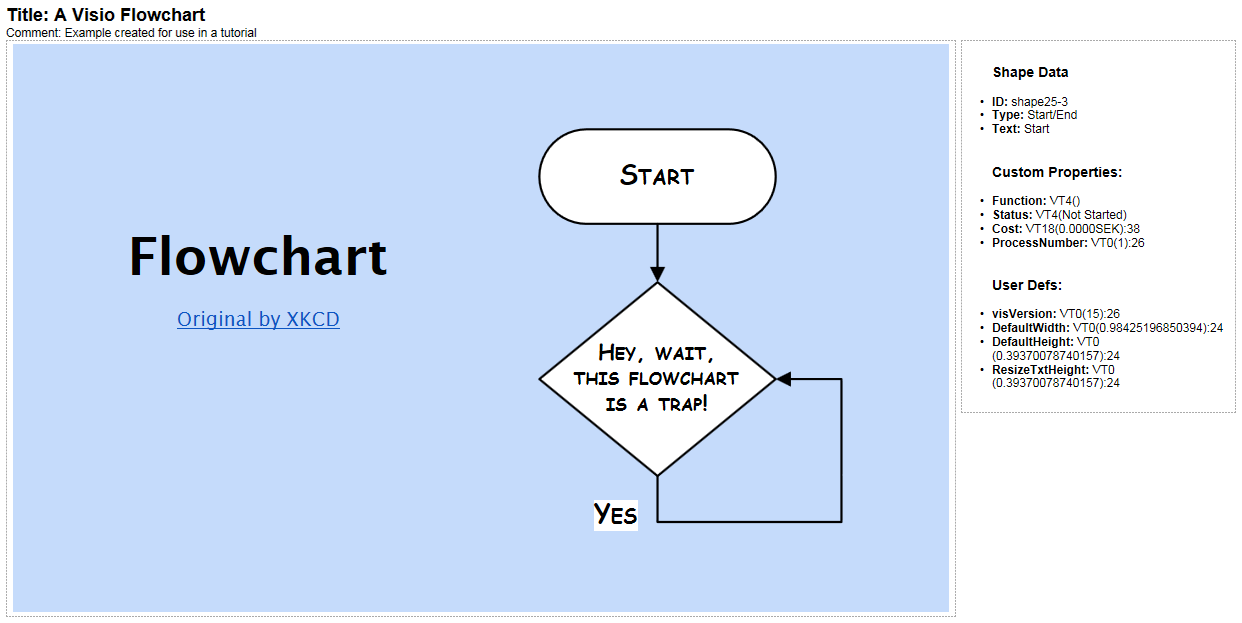
A screenshot of the sample Visio SVG that we will be working with in this tutorial. The box on the right displays metadata when hovering a shape.
In a Hurry?
Background
Scalable Vector Graphics (SVG) is a W3C standard for displaying vector graphics in the web browser. Using JavaScript you can also interact with SVG files and their DOM, similar to the browser DOM. It is well supported by all browsers, although not that many developers actually know about the file format and its advantages.
Microsoft Visio can export its .vsd/.vsdx drawings and save as SVG images. This makes it easy to put Visio drawings on the web. For a work project I needed to load such images and display data extracted from the shapes in the drawings. I chose to use Snap.svg, which is a modern open source JavaScript library for working with SVG:s (think jQuery for SVG). I soon realized that there is lack of guidance though, both for working with Snap and for parsing Visio SVG:s. So after learning about it I decided to write a guide myself :-) This tutorial guides you in creating a basic framework to get started and perform typical tasks. I’ll begin by going through some of the more interesting points. Jump to the bottom to see the full code.
Note: The code snippets below may be slightly modified or out of context compared to the real code to make it easier to read.
Let’s get started!
Load and initialize drawings with Snap.svg
There are many ways to load SVG:s on a web page. I am using the <object> tag, which is usually the recommended way:
|
1 |
<object id="svg-object" data='VisioFlowchart.svg' type='image/svg+xml' width="100%"></object> |
Using the jQuery load event (instead of the more common ready event) makes sure that the SVG file has been fully loaded before we begin to work with it:
|
1 |
$(window).on("load", function() { ... } |
We initialize Snap.svg and tell it to use the SVG in the <object> tag using its id:
|
1 |
var rootPaper = Snap("#svg-object"); |
You can have several SVG objects if you need to. Simply run run the initializer for each one in that case.
Tip: It is often useful to log Snap/SVG elements to the browser console during development, for example console.log(rootPaper). Since SVG is just XML the browser log will allow you to explore it, for example to figure out what selectors you need in order to locate the data you need.
Instead of using <object> tags, you can also load the SVG file using Snap.svg itself, and let Snap insert it into the page. Here is an example:
|
1 2 3 4 5 |
Snap.load(url, function (data) { var svgContainer = Snap("#some-empty-div-on-the-page"); svgContainer.append(data); svgPaper = Snap(svgContainer.node.firstElementChild); } |
Note: This method does not produce an identical DOM as the first initialization code. Some minor changes would be required in order to use the latter one with this tutorial.
Different ways of loading SVG:s have their advantages and disadvantages. Often what you choose is just a matter of taste. But I have also found that server settings can be cause trouble. In my case, the SharePoint Online server used response header “X-Download-Options: noopen” which forces non-recognized files to be saved instead of displayed/embedded. Since I couldn’t edit the server settings myself, letting Snap.svg load the file instead solved the problem.
Verify the file format
We can verify that this file is actually a Visio SVG by checking that it contains the proper namespace attribute (xlmns):
|
1 2 3 4 5 6 |
$(rootPaper.node.attributes).each( function(){ if( this.value === "http://schemas.microsoft.com/visio/2003/SVGExtensions/" ) { isVisioSvg = true; return false; // breaks the jQuery each() } }); |
You’ll notice that above I’m using jQuery even though this is an SVG. You can actually do a lot of SVG parsing with jQuery, but because SVG:s use a separate namespace you may run into trouble. This is why a library such as Snap.svg is useful.
Reading Visio metadata
Microsoft Office files can contain a lot of metadata. Unfortunately it appears that only the “title” and “comment” is included when exporting SVG drawings. Other Visio metadata such as “tags” and “author” are nowhere to be found :-( Getting the title and comment (“desc”) is simple as they are stored at the root level in the xml:
|
1 2 |
$("#title").text("Title: " + rootPaper.select("title").node.textContent); $("#comment").text("Comment: " + rootPaper.select("desc").node.textContent); |
Removing SVG tooltips
Browsers will pick up the <title> tag of SVG elements and display as a tooltip. This can interfere with your own application, so we can remove the node from the SVG. However, the title is the only way to know what kind of Visio shape an SVG element is. Since this is of interest to us, I’m keeping a copy of it in an attribute instead!
|
1 2 3 4 5 6 7 |
rootPaper.selectAll("g").forEach( function(elm, i) { if(elm.select("title") && elm.select("title").node) { var type = elm.select("title").node.textContent; // get the title elm.attr("shapeType", type); // save the title in our own attribute elm.select("title").remove(); // remove the original title } }); |
Seting up event handlers on Visio shapes
Event handlers in Snap are very similar to events in jQuery. First we iterate though the SVG elements, using the selector “g[id^=shape]” to match only Visio shapes:
|
1 |
rootPaper.selectAll("g[id^=shape]").forEach( function(elm, i) { |
Then simply hook up event handlers on each element (elm) just as in jQuery:
|
1 2 3 |
elm.click(function(evt) {...}); elm.mouseover(function(evt) {...}); elm.mouseout(function(evt) {...}); |
Just like in HTML, events bubble upwards through the hierarchy. In this case, the Visio “page” is at the top (or bottom if you like). We can easily stop event from bubbling:
|
1 2 |
evt.preventDefault(); evt.stopPropagation(); |
Drawing a box around clicked shapes
When clicking a shape we can draw a box around it to indicate that it is selected. First, use Snap.svg to create a new rectangle element:
|
1 |
selectionRect = shape.paper.rect(shape.x, shape.y, shape.width, shape.height); |
The new rectangle will not be visible unless we set some SVG style attributes. These are similar to HTML/CSS attributes, sometimes even named the same:
|
1 |
selectionRect.attr({fill: "none", stroke: "red", strokeWidth: 1}); |
“fill” should be evident. “stroke” refers to the border around an SVG element.
Setting “pointerEvents” to none means that the mouse will not be able to click or hover the box like normal elements:
|
1 |
selectionRect.attr({pointerEvents: "none"}); |
Now we can get boxes around the shapes! Unfortunately this is not as precise as you may be used to when working with CSS, so the box might look slightly off center. One reason for this is that getBBox() does not account for strokeWidth. I have yet to find a way to figure out the strokeWidth (especially in more complex shape-groups). You can try to set the “shapeRendering” attribute to get a better result:
|
1 |
selectionRect.attr({shapeRendering: "geometricPrecision"}); |
This is a hint to the browser how we want shapes to be rendered. In this example, “geometricPrecision” appears to give best result. Also try “optimizeSpeed” and “crispEdges”.
Tip: Another way to “fix” the rendering problems would be to skip SVG altogether and use an HTML/CSS div instead. This gives a crisp pixel perfect box. Simply add a div and style it as needed, then position it on top of the SVG element:
|
1 2 3 4 5 6 |
<div id="selection" style="border: 1px solid black; display: inline-block; position: absolute; z-index: 100; pointer-events: none;"></div> ... $("#selection").css("top", top + this.node.getBoundingClientRect().top); $("#selection").css("left", left + this.node.getBoundingClientRect().left); $("#selection").css("width", this.node.getBoundingClientRect().width); $("#selection").css("height", this.node.getBoundingClientRect().height); |
Highlighting hovered shapes
When hovering a shape with the mouse we want some kind of indication. One way is to set the shape’s opacity to 50%. We need to set both the fill and stroke opacity attributes:
|
1 |
hoveredShape.attr({fillOpacity: "0.5", strokeOpacity: "0.5"}); |
Don’t forget to reset the opacity to 1 when leaving the shape!
This works fine in our example, where the background underneath the shape is plain. If there had been a pattern though, it would not look as good. A better way would be to clone the shape and display the clone semi-transparent above the original. Unfortunately I have not gotten this to work properly, because Visio shapes are complex elements put together of multiple parts.
Parsing Visio shapes
When clicking a Visio shape we want to extract the data contained within the shape. For this, I made a function that parses an xml element and returns an object with the data.
First, make sure that this is a shape element:
|
1 2 |
var elementType = elm.node.attributes["v:groupContext"].value; if( elementType === "shape" ) { ... } |
Note: You may be wondering how I knew to look for “v:groupContext” and similar? I have not found any official documentation from Microsoft, but since SVG is an XML based format I simply inspected them in an ordinary text editor (in my case Notepad2) to figure out how they are constructed.
The shape type tells us what kind of Visio shape we are dealing with:
|
1 |
console.log( elm.node.attributes["shapeType"].value ); |
Note: “shapeType” is the attribute we previously created when we removed the tooltip.
Each shape has a id:
|
1 |
console.log( elm.node.attributes["id"].value ); |
Note: This id is unique in the drawing, but if you edit your original Visio drawing and export it to SVG again, the id might change. There is also an attribute called “v:mID” that you can use to identify shapes. In my experience, this appears to be more reliable to use.
To get the shape’s position we query the getBBox() function:
|
1 2 3 4 |
console.log( elm.getBBox().x ); console.log( elm.getBBox().y ); console.log( elm.getBBox().width ); console.log( elm.getBBox().height ); |
Note: Shape position is relative to the SVG coordinates, not the screen/browser!
Get the text inside the shape:
|
1 2 3 |
if(elm.select("desc") && elm.select("desc").node) { console.log( elm.select("desc").node.textContent ); } |
In Visio, you can right click on a shape and select properties to view and edit the “Custom Properties” of the shape. This is how to extract them:
|
1 2 3 4 5 6 7 8 9 |
if( elm.select("custProps") ) { var visioProps = elm.select("custProps").selectAll("cp"); for(var i=0; i<visioProps.length; i++) { if( visioProps[i].node.attributes["v:nameU"] && visioProps[i].node.attributes["v:val"] ) { console.log( "Key: " + visioProps[i].node.attributes["v:nameU"].value ); console.log( "Value: " + visioProps[i].node.attributes["v:val"].value ); } } } |
There are also “User Defs” which are almost identical to work with as custom properties.
Resizing the SVG <object> container
We don’t know the aspect ratio of the drawing in advance. Assuming that we want to utilize the full width of the page, we can’t set the container height until we have the aspect ratio.
A Visio drawing can contain several pages. Only one page can be exported to SVG, but the concept of a page remains as the root element. We can get the bounding box of this Visio page:
|
1 2 3 4 5 6 7 8 9 |
rootPaper.selectAll("g").forEach(function(elm){ if(elm.node.attributes["v:groupContext"] && elm.node.attributes["v:groupContext"].value === "foregroundPage") { visioPage = elm.node; x = visioPage.getBBox().x; y = visioPage.getBBox().y; w = visioPage.getBBox().width; h = visioPage.getBBox().height; } } |
Using this we can calculate the aspect ratio and change the height of the <object> container to show as much as possible of the drawing taking into account this aspect ratio:
|
1 |
$("#svg-object").height( $("#svg-object").width() / (w/h) ); |
Zooming in on the drawing
Visio adds a unnecessary empty border around the page. Let zoom in the drawing to better utilize the available space!
We can make a new viewBox to shows as much as possible of the drawing. I’m adding a small margin here, but it is quite inaccurate because getBBox() does not account for strokeWidth. Using a relative marginY appears to give descent result for my needs, but you may need to try something different yourself.
|
1 2 3 |
var marginX = 1; var marginY = (w/h); var newViewBox = (x-marginX) + " " + (y-marginY) + " " + (w+marginX*2) + " " + (h+marginY*2); |
Note: The viewbox is a property of SVG that specifies what part of the drawing to display. The actual drawing can extend beyong this viewbox so you would have to pan the drawing to view it all.
Now we can use a new viewBox to resize the SVG to make it fill the entire object canvas:
|
1 |
rootPaper.animate({viewBox: newViewBox}, 300, mina.easeinout); |
Here I am also using Snap’s animation feature for a nice effect when loading the page. 300 is the animation duration, “mina.easeinout” is the animation easing. Other easings are: easeinout, linear, easein, easeout, backin, backout, elastic & bounce.
The complete code
I hope you enjoyed this tutorial and learned something new. Here is the complete, fully commented code, including the html/css page. Again, you can get this together with the sample SVG on GitHub.
|
1 2 3 4 5 6 7 8 9 10 11 12 13 14 15 16 17 18 19 20 21 22 23 24 25 26 27 28 29 30 31 32 33 34 35 36 37 38 39 40 41 42 43 44 45 46 47 48 49 50 51 52 53 54 55 56 57 58 59 60 61 62 63 64 65 66 67 68 69 70 71 72 73 74 75 76 77 78 79 80 81 82 83 84 85 86 87 88 89 90 91 92 93 94 95 96 97 98 99 100 101 102 103 104 105 106 107 108 109 110 111 112 113 114 115 116 117 118 119 120 121 122 123 124 125 126 127 128 129 130 131 132 133 134 135 136 137 138 139 140 141 142 143 144 145 146 147 148 149 150 151 152 153 154 155 156 157 158 159 160 161 162 163 164 165 166 167 168 169 170 171 172 173 174 175 176 177 178 179 180 181 182 183 184 185 186 187 188 189 190 191 192 193 194 195 196 197 198 199 200 201 202 203 204 205 206 207 208 209 210 211 212 213 214 215 216 217 218 219 220 221 222 223 224 225 226 227 228 229 230 231 232 233 234 235 236 237 238 239 240 241 242 243 244 245 246 247 248 249 250 251 252 253 254 255 256 257 258 259 260 261 262 263 264 265 266 267 268 269 270 271 272 273 274 275 276 277 278 279 280 281 282 283 284 285 286 287 288 289 290 291 292 293 294 295 296 297 298 299 300 301 302 303 304 305 306 307 308 309 310 311 312 313 314 315 316 317 318 319 320 321 322 323 324 325 326 327 328 329 330 331 332 333 334 335 336 337 338 339 340 341 342 343 344 345 346 347 348 349 350 351 352 353 354 355 356 357 358 359 |
<!doctype html> <html> <head> <script src="jquery.min.js"></script> <script src="snap.svg-min.js"></script> <style> body { background-color: #eee; font-family: sans-serif; font-size: 12px; } #title { font-size: 18px; font-weight: bold; } #comment { font-size: 12px; color: #888; } #svg-object { background-color: white; border: 1px dashed #aaa; float: left; width: 75%; vertical-align:top; /* prevents spurious border below the SVG */ } .output { background-color: white; width: 20%; margin-left: 5px; float: left; border: 1px dashed #aaa; padding: 10px; float: left; pointer-events: none; } .output ul { padding-left: 20px; } </style> </head> <body> <div id="title"></div> <div id="comment"></div> <object id="svg-object" data='VisioFlowchart.svg' type='image/svg+xml' width="100%"></object> <div class="output"> <ul id="output"></ul> </div> <script> // Using the jQuery load() event instead of the more common ready() event. // This makes sure that the SVG file has been fully loaded before we begin to work with it. $(window).on("load", function() { 'use strict' var selectionRect, hoveredShape; // Initialize Snap.svg and tell it to use the SVG data in the <object> tag var rootPaper = Snap("#svg-object"); // Instead of using <object> tags, you can also load SVG files using Snap.svg itself. Here is an example: /* Snap.load(url, function (data) { var svgContainer = Snap("#some-empty-div-on-the-page"); svgContainer.append(data); svgPaper = Snap(svgContainer.node.firstElementChild); } */ // Note: If you want to use something like this instead, some minor changes to the code in this tutorial would be required. // Often what you choose is a matter of requirements and/or taste. But I have also found that server settings can be cause trouble. For example, SharePoint Online uses a response header for non-recognized files (such as SVG) that forces the browser to promt to save the file instead of allowing it to be embedded in an <object> tag. In this case, letting Snap load the file instead would solve the problem! // Verify that this is actually a Visio SVG var isVisioSvg = false; $(rootPaper.node.attributes).each( function(){ if( this.value === "http://schemas.microsoft.com/visio/2003/SVGExtensions/" ) { isVisioSvg = true; return false; // breaks the jQuery each() } }); if(!isVisioSvg) { console.log("Not a Visio SVG!"); return; } // Tip: It is often useful to log Snap/SVG elements to the console. There you can examine the object to figure out what selectors you need in order to locate the data you need. console.log(rootPaper); // Get visio metadata // Unfortunately only the title and comment appears to be exported to SVG drawings. Other Visio metadata such as tags and author are nowhere to be found. $("#title").text( "Title: " + rootPaper.select("title").node.textContent ); $("#comment").text( "Comment: " + rootPaper.select("desc").node.textContent ); // Remove SVG tooltips rootPaper.selectAll("g").forEach( function(elm, i) { // Browsers will pick up the <title> tag and display as a tooltip. This can interfere with your own application, so we can remove it this way. // But the title tells us what kind of Visio shape it is, so we keep a copy of it in an atribute instead. if(elm.select("title") && elm.select("title").node) { var type = elm.select("title").node.textContent; elm.attr("shapeType", type); elm.select("title").remove(); } }); // Setup event handlers on shapes rootPaper.selectAll("g[id^=shape]").forEach( function(elm, i) { // Click event elm.click(function(evt) { // Call a helper function (see further down) to get the Visio shape clicked var shape = parseShapeElement(this); if(!shape) return; console.log("SVG Click"); // Clear the previous selection box (if any) if(selectionRect) { selectionRect.remove(); } // Draw a box around the selected shape // Unfortunately this is not as precise as one is used to when working with CSS, so the box might be slightly off // One reasone for this is that getBBox() does not account for strokeWidth, and I have yet to find a way to read this (especially in more complex shape-groups). selectionRect = shape.paper.rect(shape.x, shape.y, shape.width, shape.height); // The new selection rect will not be visible unless we set some SVG style attributes. // These are similar to HTML/CSS attributes, sometimes even idential. // Note that we are setting more than one attribute in a single call here. // "fill" should be evident. "stroke" refers to the border around an SVG element. selectionRect.attr({fill: "none", stroke: "red", strokeWidth: 1}); // Setting "pointerEvents" to none means that the mouse will never be able to click/hover this element. selectionRect.attr({pointerEvents: "none"}); // Setting the "shapeRendering" attribute allows to hint to the browser how shapes should rendered. // In this example, "geometricPrecision" appears to give best result. Also try "optimizeSpeed" and "crispEdges" selectionRect.attr({shapeRendering: "geometricPrecision"}); // Finally stop the click event from bubbling up to the Visio "page" evt.preventDefault(); evt.stopPropagation(); }); // Mouse hovering event elm.mouseover(function(evt) { var shape = parseShapeElement(this); if(!shape) return; // Set cursor to pointer to indicate that we can click on shapes // (We could have set this elsewhere; this was just a convenient place) elm.attr({cursor: "pointer"}); // When hovering a shape we want some kind of indication. // Setting the shape opacity to 50% works fine in our example. Depending on the background underneath the shape this may not work though. // Alternatively we could have used a something similar to when selecting shapes, drawing a rectangle around it. // Ideally we would want to clone the shape and display on top. Unfortunately I have not gottent this to work properly. The problem likely stems from Visio shapes being complex elements put together of multiple parts. if(hoveredShape) { // First reset any previous shape that we hovered hoveredShape.attr({fillOpacity: "1", strokeOpacity: "1"}); } // Set the opacity attributes to 50% on the current hovered shape hoveredShape = this; this.attr({fillOpacity: "0.5", strokeOpacity: "0.5"}); // Print data found in the Visio shape to the output panel // To see how these were obtained, see parseShapeElement() below $("#output").empty(); if(shape) { $("#output").append( $("<h3>Shape Data</h3>") ); $("#output").append( $("<li><b>" + "ID:</b> " + shape.id + "</li>") ); $("#output").append( $("<li><b>" + "Type:</b> " + shape.type + "</li>") ); $("#output").append( $("<li><b>" + "Text:</b> " + shape.text + "</li>") ); var keys, i; $("#output").append( $("<br><h3>Custom Properties:</h3>") ); keys = Object.getOwnPropertyNames(shape.props); for(i=0; i<keys.length; i++) { $("#output").append( $("<li><b>" + keys[i] + ":</b> " + shape.props[keys[i]] + "</li>") ); } $("#output").append( $("<br><h3>User Defs:</h3>") ); keys = Object.getOwnPropertyNames(shape.defs); for(i=0; i<keys.length; i++) { $("#output").append( $("<li><b>" + keys[i] + ":</b> " + shape.defs[keys[i]] + "</li>") ); } } else { $("#output").append( $("<i>Not a shape...</i>") ); } }); // Mouse leave event elm.mouseout(function(evt) { // Reset a few things when the mouse is no longer hovering the shape $("#output").empty(); if(hoveredShape) { hoveredShape.attr({fillOpacity: "1", strokeOpacity: "1"}); hoveredShape = null; } }); }); // Also add a click event handler to the background rootPaper.click(function(evt) { console.log("SVG Click on Paper"); if(selectionRect) { selectionRect.remove(); } }); // End SVG event handler setup // This helper function will take an element and try to parse it as a Visio shape // It will return a new object with the properties we are interested in function parseShapeElement(elm) { // Figuring out where things are located in Visio SVG:s and what they are named, such as "v:groupContext" was done by inspecting examples in and ordinary text editor var elementType = elm.node.attributes["v:groupContext"].value; if( elementType === "shape" ) { // Create the object to hold all data we collect var shape = {}; // The shape type tells us what kind of Visio shape we are dealing with shape.type = elm.node.attributes["shapeType"].value; // Make sure this Visio shape is of interest to us. // "dynamic connector" corresponds to arrows // "sheet" can be the background or container objects var doNotProcess = ["sheet", "dynamic connector"]; var type = shape.type.toLowerCase(); for(var i=0; i<doNotProcess.length; i++) { if(type.indexOf(doNotProcess[i]) !== -1) { return null; } } // Let begin collecting data! shape.paper = elm.paper; // Each shape has a unique id shape.id = elm.node.attributes["id"].value; // Shape position is relative to the SVG coordinates, not the screen/browser shape.x = elm.getBBox().x; shape.y = elm.getBBox().y; shape.width = elm.getBBox().width; shape.height = elm.getBBox().height; // Get the text inside the shape shape.text = ""; if(elm.select("desc") && elm.select("desc").node) { shape.text = elm.select("desc").node.textContent; } // Get "Custom Properties" of the shape // In Visio, right click on a shape and select properteis to view/edit these shape.props = {}; if( elm.select("custProps") ) { var visioProps = elm.select("custProps").selectAll("cp"); for(var i=0; i<visioProps.length; i++) { if( visioProps[i].node.attributes["v:nameU"] && visioProps[i].node.attributes["v:val"] ) { shape.props[visioProps[i].node.attributes["v:nameU"].value] = visioProps[i].node.attributes["v:val"].value; } } } // Get "User Defs" (whatever that is...) shape.defs = {}; if( elm.select("userDefs") ) { var visioDefs = elm.select("userDefs").selectAll("ud"); for(var i=0; i<visioDefs.length; i++) { if( visioDefs[i].node.attributes["v:nameU"] && visioDefs[i].node.attributes["v:val"] ) { shape.defs[visioDefs[i].node.attributes["v:nameU"].value] = visioDefs[i].node.attributes["v:val"].value; } } } return shape; } else { // Not a Visio shape return null; } } // Visio will add an empty border around the Visio page in the SVG // This function will try to fit the SVG as best can in its container to show as much as possible of the drawing // It will also resize the container to make the most of the available space // All this while preserving aspect ratio of the SVG function resizeSvgAndContainer(objectElementId) { // Get the container var objectElement = $(objectElementId); // Get bounding box of the (Visio) page rootPaper.selectAll("g").forEach(function(elm){ if(elm.node.attributes["v:groupContext"] && elm.node.attributes["v:groupContext"].value === "foregroundPage") { var visioPage = elm.node; // The "Bounding Box" contains information about an SVG element's position var x = visioPage.getBBox().x; var y = visioPage.getBBox().y; var w = visioPage.getBBox().width; var h = visioPage.getBBox().height; // Figure out a new viewBox that shows as much as possible of the drawing // The viewbox is a property of SVG that specifies what part of the drawing to display. The actual drawing can extend beyong this viewbox so you would have to pan the drawing to view it all. // It is not perfect. This is probably because getBBox does not include account for strokeWidth, and I have yet to find out a way to figure this out. // This can cause shapes to be clipped. I am adding marging to the new viewbox to try and fix this. Using a relative marginY appears to give decent result for most of my needs. You may need to try something different yourself. var marginX = 1; var marginY = (w/h); var newViewBox = (x-marginX) + " " + (y-marginY) + " " + (w+marginX*2) + " " + (h+marginY*2); // The width of the container is fixed. But we can alter the height to show as much as possible of the drawing at its specified aspect ratio. objectElement.height( objectElement.width() / (w/h) ); // Set SVG to make Visio page fill entire object canvas // Here I am also using Snap's animation feature for a nice effect when loading the page // 300 is the animation duration, "mina.easeinout" is the animation easing. Other easings are: easeinout, linear, easein, easeout, backin, backout, elastic & bounce. rootPaper.animate({viewBox: newViewBox}, 300, mina.easeinout); } }); } // Call the resize function at startup resizeSvgAndContainer("#svg-object"); // Also register an event handler if window should resize in the future $(window).resize(function () { resizeSvgAndContainer("#svg-object"); }); }); </script> </body> </html> |

Hi Dan, this was very useful to me as I am learning Java. Such tutorials help us to learn quickly. Must read for all beginners. Thanks a lot for sharing. :)
Thanks for taking time and effort to render the Visio SVG in a comprehensive manner. I’ve one issue, which is very important for me to accomplish… the hyperlink behind the shape is not working?
The click mouse event is not passing the native effect of the SVG shape link launch. The raw Visio SVG does activate the hyperlinks though!
Am I missing something?
Thanks
You probably need to experiment with “pointerevents” by adding it to containing shape:
pointerEvents: “none”
This should make the mouse click event pass through the shape and find the link!
I just commented “elm.preventDefault()” that prevented the click event from firing. It seems to work, but the SharePoint is blocking the call to another site in it’s response header with SAMEREGION restriction.
I’ll try the same on another WebServer and confirm the above later.
The SAMEREGION response header restriction is gone when the hyperlink in visio is set to open in ‘new’ window… using the ShapeSheet…
I’m now struggling with another issue…
The shape click event… – The rectangular red box goes way off on the screen when ‘clicked’ shape is part of a visio ‘groupContext’. Appreciate any workaround to render the ‘red’ box on the grouped shapes as accurate as possible.
Thanks
I remember some similar trouble, but I never got around to solve it myself. If you do find a solution, please share!
can you please show example how exactly use
”
Snap.load(url, function (data) {
var svgContainer = Snap(“#some-empty-div-on-the-page”);
svgContainer.append(data);
svgPaper = Snap(svgContainer.node.firstElementChild);
}”
with your tutorial ?
Thanks a ot Dan. @Hynek try lower case C in “v:groupContext”. If you use load it will parse the svg as “v:groupcontext”